You are using an out of date browser. It may not display this or other websites correctly.
You should upgrade or use an alternative browser.
You should upgrade or use an alternative browser.
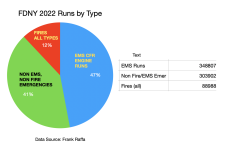
Chart - 2022 FDNY Runs by type
- Thread starter Capttomo
- Start date
- Joined
- Apr 1, 2007
- Messages
- 4,352
I find these numbers fascinating . . . from my never on the job point of view. In 2022, "Beyond the Fires" calls totaled 303, 902, but only 120 made it onto this site. Yeah, I know . . . there weren't anything like 88,988 fires posted here, either (I'm not going to count them  ). So there must have been many, many "nothing" calls of both types (burning stripped car, cat up a tree, that sort of thing). I'm sure that those of you who are on the job or spent careers there are not even remotely surprised by these numbers . . . but I was. One question: would 10-92's be included in those 300,000+ incidents?
- Joined
- Dec 14, 2012
- Messages
- 448
Absolutely. All runs of all types are rightfully taken credit for.I find these numbers fascinating . . . from my never on the job point of view. In 2022, "Beyond the Fires" calls totaled 303, 902, but only 120 made it onto this site. Yeah, I know . . . there weren't anything like 88,988 fires posted here, either (I'm not going to count them). So there must have been many, many "nothing" calls of both types (burning stripped car, cat up a tree, that sort of thing). I'm sure that those of you who are on the job or spent careers there are not even remotely surprised by these numbers . . . but I was. One question: would 10-92's be included in those 300,000+ incidents?
- Joined
- Jun 27, 2007
- Messages
- 3,765
Boston alternates its medical runs, drug overdoses, difficulty breathing, etc between engines and ladders, this is the engine companies month. Does FDNY do this as well?
- Joined
- Jun 16, 2020
- Messages
- 54
NoBoston alternates its medical runs, drug overdoses, difficulty breathing, etc between engines and ladders, this is the engine companies month. Does FDNY do this as well?
The official 2022 FDNY statistics released earlier this year for the five basic incident response categories:
Structural Fires 23,677 3.64%
Non-Structural Fires 14,192 2.18%
Non-Fire Emergencies 235,736 36.26%
Medical Emergencies 355,623 54.70%
Malicious False 20,959 3.22%
Total 650,187 100%
Data source: “Fire Department of New York – an Operational Reference – January, 2023” and used with permission.
Structural Fires 23,677 3.64%
Non-Structural Fires 14,192 2.18%
Non-Fire Emergencies 235,736 36.26%
Medical Emergencies 355,623 54.70%
Malicious False 20,959 3.22%
Total 650,187 100%
Data source: “Fire Department of New York – an Operational Reference – January, 2023” and used with permission.
Last edited:
- Joined
- Mar 7, 2023
- Messages
- 343
the January 2023 operational reference book is out ?
- Joined
- Aug 16, 2008
- Messages
- 1,187
Where can it be bought?the January 2023 operational reference book is out ?
- Joined
- Mar 7, 2023
- Messages
- 343
i was asking if it is out
- Joined
- Aug 16, 2008
- Messages
- 1,187
Oh ok!i was asking if it is out
- Joined
- Jun 27, 2007
- Messages
- 3,765
an on-line search today only went up to the 12th edition. But I am patiently awaiting.

